> For the complete documentation index, see [llms.txt](https://docs.satoshiterminal.io/llms.txt). Markdown versions of documentation pages are available by appending `.md` to page URLs; this page is available as [Markdown](https://docs.satoshiterminal.io/research-suite/user-guide/advanced-charting.md).
# Advanced Charting
## Intraday & Historical Charts
**How to Access**
Right-click on a symbol in a Market Window, Custom list, chain or a Market Page and select Chart > Historical Chart or Chart > Intraday Chart.
**Description**
The terminal's charts are very comprehensive and includes the following features:
* Intraday charts with up to 90 days of data
* Historical charts with end-of-day data
* More than 35 Technical analysis studies
* Compare Studies
* Currency conversion of charts
* Customized time periods, layout, default settings and more
* Linking of charts
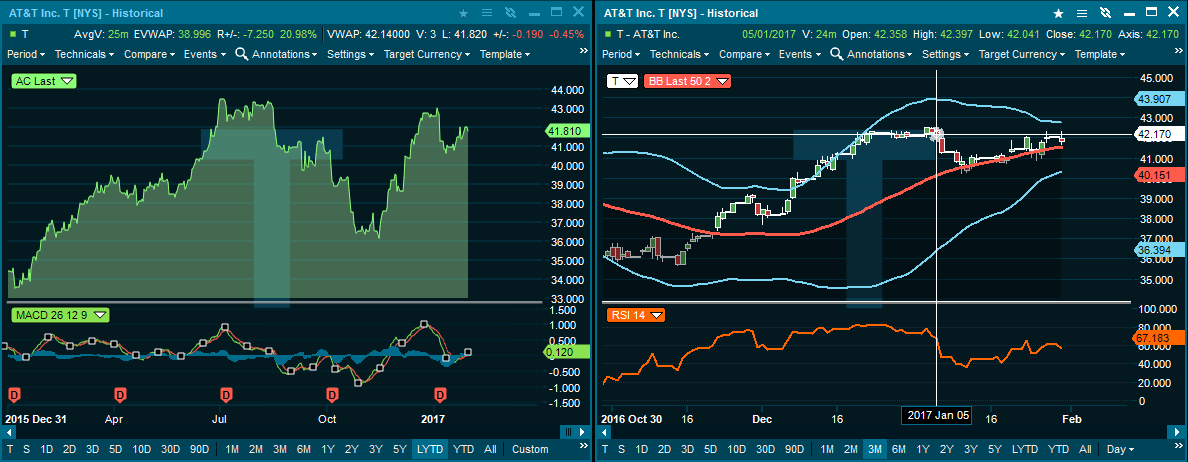
**Chart tool bar**
At the top of the chart window there is a tool bar you can use to modify the chart layout. This menu is also available by right clicking in the chart.

**Time period and Resolution**
Time Period can be selected from either the "Period" dropdown in the toolbar or below the chart as a separate toolbar. To add or remove the toolbar below the chart, click the wrench icon followed by "Show period toolbar". A custom dialog is available for selecting custom timer periods and resolution. The resolution can vary from 1 day to All available for intraday charts and from 1 month to All available for historical charts.
**Technicals**
The most used technical analysis indicators is available from the drop-down. By clicking the "More" button the available Technical Analysis studies will be listed.
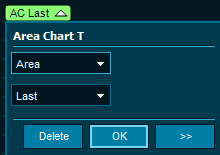
**Change chart type**
Click on the symbol in the chart and choose from the menus if you would like candlesticks, line, area or bar chart.
**Compare**
Compare symbols in the same chart by using the compare menu. You can add as many symbols are you want. The most commonly used is percentage change.
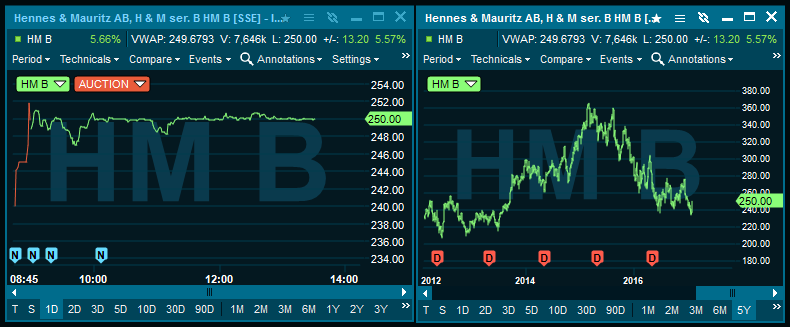
**Events**
Events including news, auctions, splits and dividends can be shown in a chart. Use the events menu to add and remove them.
**Annotations**
Annotations enables the use of trendlines, arrows, Fibonacci etc. Trendlines support start and end time by right clicking and selecting properties. There are two modes of drawing trendlines available in the application. Either by holding down ctrl or simply by drawing freely, to switch between the two modes go to Tools | Preferences |Charts, then check the box for "Use annotation zoom mode".
**Template support**
It is now possible to create own chart templates for different purposes in addition to templates provided from the terminal. This feature also allows the end user to easily create a default template for each chart. There is a selection of templates added to show the new possibilities in the chart interface.
**Settings**
Percent study can now quickly be added to the left axis and better support for gridlines. The symbol parameters command shows a dialogue with parameters specific for the selected symbol. You can choose a chronological axis for historical charts and configure an Update filter to remove extreme values.
**Scroll bar**
The scroll bar changes the time period (start- and end date displayed) and it is possible to move the selected time period to the desired position.
**Chart cursor**
Click the chart cursor button to enable a cursor that will show the current values of any point in the chart. A large cross will follow the mouse cursor and show the following information with the cross: Date, Time, Open, High, Low, Close, Volume.
**Zoom in and out**
You can zoom by clicking the chart by clicking in the chart, holding down the mouse, and dragging the mouse to the the right. When the desired area is highlighted, release the button. To zoom out, drag the mouse to the left.
**Drag and drop**
Click on a symbol from a custom list, market window or chain and drag the symbol to a chart window and release the mouse button. This will change the symbol in the chart.
**Target currency**
Target currency can be changed in order to quickly see the graphs in another currency than the symbol's own trading currency. Click "Settings" in the to toolbar menu and click on the "Currency" sub menu. Select the desired currency from the list of available currencies.
**Chart Type**
By clicking the legend it is possible to change the chart to :
* Line Chart
* Bar Chart
* Candle Stick
**Horizontal Axis**
By right-clicking directly on the horizontal axis in the chart window, you can toggle the settings for the grid lines and show first date/last time.
**Vertical Axis**
By right-clicking directly on the vertical axis in the chart window, you can toggle the settings for a logarithmic scale, show last marker, show grid lines and show legend.
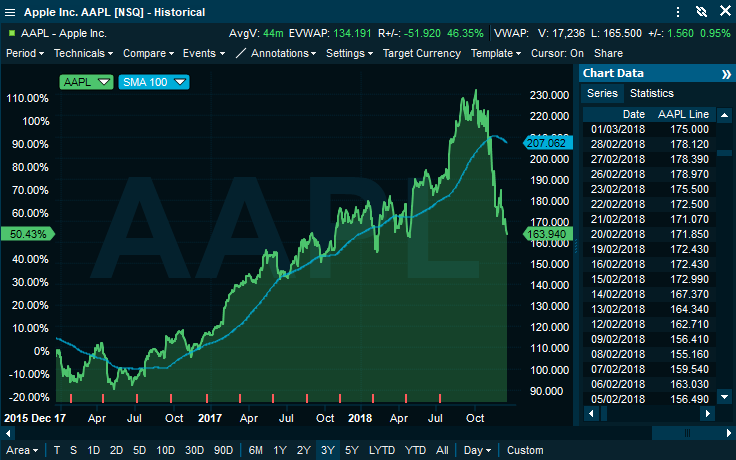
**Ranged values**
New values are added to the top of the chart menu, these values reflect the time period selected in the chart.
* Accumulated Volume for intraday charts and Average Volume for historical charts
* Estimated VWAP
* Ranged +/- (%)
**Watermark**
Watermarks show up in the background of the chart, and can be configured to show symbol code or description.
**Other chart features:**
* Unique colors of the lines in charts when adding a study
* Add percent to left axis by right clicking on the price axis.
## Chart Grid
**Description**
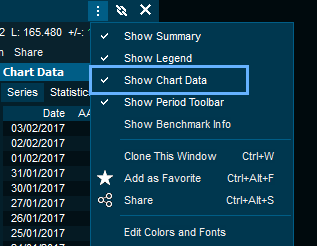
In the chart window, a grid containing data series and statistics for all graphs can be expanded into view.
In some cases the grid will be hidden by default. It can be viewed by selecting chart-menu -> select Show Chart Grid.
When displayed, you can change the width of the grid by click and drag the vertical splitter line between the grid and the chart itself.
From the right-click menu in the grid, it is possible to hide the date and or the time column. The width of each column will be saved as a part of the workspace.
It is possible to copy all the data from the columns into the clipboard. Use the Ctrl+V short cut to select all (or use the menu Select All in the right click menu) and then Ctrl+C to copy.
The selected row in the grid works along with the chart cursor. When the cursor is active, the selected row will follow any movement to the cursor.
## Return Histogram
This window displays the empirical distribution of the daily returns for a particular instrument or portfolio.
**Period**
Time series length. Options: All, last year to date (LYTD), year to date (YTD), and 1 to 5 years. The user can also customize the length of the series selection ‘Custom’.
**Timeline**
Allows the user to select the overview of the series in the lower panel. ‘Daily returns’ displays the log returns in a bar chart, and ‘History’ the actual values of the series.
**Statistics bar**
On the top of the histogram it is displayed the moments of the empirical distribution.
*Mean*: Log daily returns
*Sigma*: Standard deviation from the log return series
*Skewness*: Standardized skewness of the empirical distribution as in Pearson’s moment coefficient of skewness.
*Kurtosis*: Excess kurtosis of the empirical distribution
## Chart Annotation
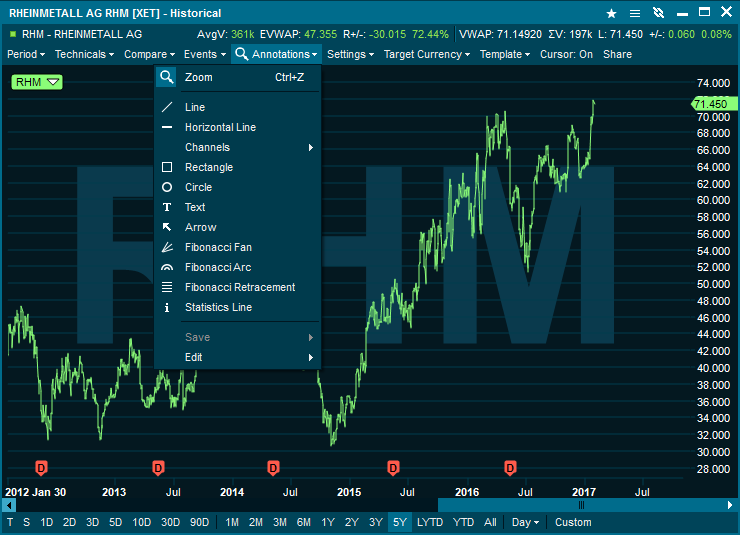
Annotations can be added on top of any line, bar or candlestick chart. There is no limit to the number of annotations that can be added to a chart. All annotations can be saved from the Annotations drop down menu to the main symbol.
The annotation tools are found in the annotation drop down at the top of the chart.
In addition to the annotation tools there is a select tool which will either select a graph (click), edit a graph (double click) or zoom (click and drag on the chart) when used. When an annotation tool is selected, hold down the control key in order to draw. Then click on the starting point for the annotation in the chart. Still holding both the control key and left mouse button down, drag the mouse to the end point for the annotation and release the left mouse button (and the control key). The annotation will now draw itself in the selected coordinates in the chart. For all annotation tools it is also possible to move it to another position or to change the start or end position. This is done by click and hold the left mouse button on the annotation tools grip handle, a black box.
There are two modes of drawing trendlines available in the application. Either by holding down ctrl or simply by drawing freely, to switch between the two modes go to Tools | Preferences |Charts, then check the box for "Use annotation zoom mode"
**Shortcuts**
Zoom: Ctrl+Home
Select: Ctrl+End
**Line**
To draw a line (trend line), select it from the annotation tool bar, click and hold the left mouse button in the chart and drag to draw the new line. The selected trend line will be indicated with a selection handle at each end. Click and drag a selection handle to change the angle or the length of the line.
A trend line cannot be manually drawn past the last time point in the chart, but it is possible to right click and select Extend Future.
There is also a separate option called Extend Past that extends the line backwards in time. The short cut menu (also available from the toolbar) contains commands to duplicate, delete and change the color and widths of the selected (or all) lines. This behaviour is also applies to horizontal parallel lines, vertical parallel lines, rectangle, circle and arrow.
**Text**
A text box can be added anywhere in the chart. It is possible to change the properties of the font and the box from the text property dialog.
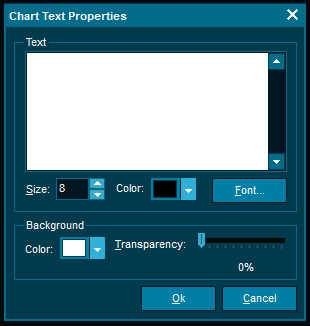
This dialog is displayed when adding a new text annotation to the chart, or by right click on an existing one. All annotation tools has a start and an end point except for text. To add a text box just single click on the chart, which will be the top left corner of the box. The background color can be set to a % transparency blending with the chart itself.
**Fibonacci arc**
A charting technique consisting of three curved lines that are drawn for the purpose of anticipating key support and resistance levels, and areas of ranging. Fibonacci arcs are created by first drawing a trend line between two points (usually the high and low in a given period), and then by drawing three curves that intersect this trend line at the key Fibonacci levels of 38.2%, 50% and 61.8%. Transaction decisions are made when the price of the asset crosses through these key levels.
When the chart overlay mode is in “zoom” or another drawing mode, the Fibonacci controlling trend line is not visible. If the chart overlay mode is “select”, the controlling trend line is visible and it is possible to change the position of the arc.
**Fibonacci fan**
Fibonacci fan is a charting technique consisting of three diagonal lines that use Fibonacci ratios to help identify key levels of support and resistance. Fibonacci fans are created by first drawing a trend line through two points (usually the high and low in a given period), and then by dividing the vertical distance between the two points by the key Fibonacci ratios of 38.2%, 50% and 61.8%. The result of these divisions each represents a point within the vertical distance. The three 'fan' lines are then created by drawing a line from the leftmost point to each of the three representing a Fibonacci ratio.
As for the arc, the trend line is not visible when the chart mode is in zoom mode or another draw mode.
**Fibonacci retracement**
A term used in technical analysis that refers to the likelihood that a financial asset's price will retrace a large portion of an original move and find support or resistance at the key Fibonacci levels before it continues in the original direction. These levels are created by drawing a trend line between two extreme points and then dividing the vertical distance by the key Fibonacci ratios of 23.6%, 38.2%, 50%, 61.8% and 100%.
**Fibonacci properties**
All the three Fibonacci lines have a property dialog where it is possible to alter the default settings. The property dialog is opened by selecting the Fibonacci object, right click and then select “Properties…” from the popup dialog. The most important thing to notice is the possibility to change the color and width for the levels.
## Chart Customization
Chart Templates can be used for several purposes such as:
* Create a default charting layout
* Create different technical analysis templates
* Quickly change charting layout without manually adding removing or adding elements to the chart
* Create several color themes for different chart types.
**How to access**
Access the Templates menu by selecting the "Template" dropdown in the chart:
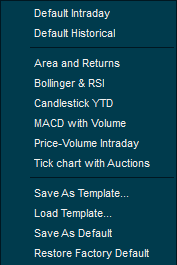
**Creating template**
When you are content with a chart and want to use it as a template, save the chart from the Template drop down and it will be available from any chart window.
1. **Timeframe Selection**
* Options: 1 tick, 1 second, 1 minute, 5 minutes, 15 minutes, 30 minutes, 1 hour, 4 hours, Daily, Weekly, Monthly
* Custom Timeframe: Define a custom timeframe (e.g., 3.5 hours)
2. **Chart Type Selection**
* Options: Line Chart, Bar Chart, Candlestick Chart, Heikin-Ashi
* Advanced Candlestick Styles: Customize candlestick styles (e.g., Marubozu, Gravestone Doji)
3. **Technical Indicators**
* Options: Moving Averages (SMA, EMA, WMA), RSI (14, 21, Custom Periods), MACD (12, 26, 9), Bollinger Bands (20, 2, Custom Parameters), Stochastic Oscillator (14, 3, 3)
* Advanced Indicator Settings: Adjust indicator smoothing, color, and plot styles
4. **Drawing Tools**
* Options: Trendlines, Fibonacci Retracements, Channels, Support/Resistance Lines, Pitchfork
* Advanced Fibonnaci Levels: Customize Fibonacci levels (e.g., 0.382, 0.618, 1.618)
5. **Color Themes**
* Options: Light Theme, Dark Theme, Custom Color Palette
* Advanced Color Customization: Modify color intensity, opacity, and hue
6. **Background Color**
* Options: White, Black, Custom Color, Gradient Background
* Advanced Background Settings: Apply texture or image backgrounds
7. **Grid Lines**
* Toggle: Show/Hide
* Advanced Grid Options: Customize grid style, thickness, and color
8. **Axis Scale Adjustment**
* Options: Linear, Logarithmic, Auto-Scale
* Advanced Scaling: Adjust scaling parameters for more precise analysis
9. **Chart Size Adjustment**
* Options: Small, Medium, Large, Custom Size
* Advanced Sizing: Specify exact pixel dimensions for custom size
10. **Zoom In/Out**
```
- Options: Zoom In, Zoom Out, Fit to Screen, Custom Zoom Levels
- Advanced Zoom: Zoom to specific price range or time period
```
1. **Multiple Chart Windows**
```
- Toggle: Enable/Disable, Tile Windows, Arrange Horizontally/Vertically
- Advanced Window Layout: Configure multiple monitors, save and load layouts
```
1. **Overlay Comparison**
```
- Options: None, Compare with Index, Compare with Another Symbol, Custom Comparison Symbol
- Advanced Comparison Metrics: Choose from various benchmark indices or custom symbols
```
1. **Chart Templates**
```
- Options: Save Template, Load Template, Share Template
- Advanced Template Management: Organize templates into categories, set default templates
```
1. **Data Point Markers**
```
- Toggle: Show/Hide
- Advanced Marker Styles: Choose from various shapes, customize size and color
```
1. **Price Alert Lines**
```
- Toggle: Enable/Disable, Set Custom Alerts
- Advanced Alerts: Set conditional alerts based on technical conditions or custom criteria
```
1. **Event Markers**
```
- Toggle: Show/Hide, Customize Marker Icons
- Advanced Event Annotation: Add custom notes, attach external links to events
```
1. **Fibonacci Tools**
```
- Toggle: Show/Hide
- Advanced Fibonnaci Customization: Choose alternative methods (e.g., Arcs, Fans)
```
1. **Chart Aggregation**
```
- Options: Daily, Weekly, Monthly, Intraday Aggregation
- Advanced Aggregation: Adjust session start/end times, apply custom roll-up rules
```
1. **Session Breaks**
```
- Toggle: Show/Hide, Customize Break Intervals
- Advanced Session Options: Highlight specific trading sessions, customize session colors
```
1. **Price Line Styles**
```
- Options: Solid, Dashed, Dotted, Custom Line Styles
- Advanced Line Customization: Choose from various line styles, customize thickness
```
1. **Volume Overlay**
```
- Toggle: Show/Hide, Overlay on Price Chart or Separate Panel
- Advanced Volume Display: Choose between standard and volume-weighted price display
```
1. **News Feeds Integration**
```
- Toggle: Enable/Disable, Customize News Source
- Advanced News Filtering: Filter news by keywords, sources, or categories
```
1. **Crosshair Tool**
```
- Toggle: Show/Hide
- Advanced Crosshair Features: Display additional information (e.g., coordinates, values)
```
1. **Heatmaps**
```
- Toggle: Enable/Disable, Customize Heatmap Intensity
- Advanced Heatmap Settings: Adjust color gradients, apply custom data scaling
```
1. **Trading Sessions Overlay**
```
- Toggle: Show/Hide
- Advanced Trading Session Configuration: Highlight specific session ranges, customize session colors, display extended trading hours
```
1. **Customizable Time Zones**
```
- Options: UTC, Local Time, Custom Time Zone
- Advanced Time Zone Configuration: Specify daylight saving time rules, set location-based time zones
```
1. **Period Separator Lines**
```
- Toggle: Show/Hide
- Advanced Separator Options: Customize line style, thickness, and color
```
1. **Historical Price Data Adjustments**
```
- Toggle: Enable/Disable
- Advanced Adjustments: Apply inflation-adjusted or dividend-adjusted historical data
```
1. **Extended Trading Hours Display**
```
- Toggle: Show/Hide
- Advanced Extended Hours Settings: Customize session color, display pre-market and after-hours separately
```
1. **Price Line Styles**
```
- Options: Solid, Dashed, Dotted, Custom Line Styles
- Advanced Line Customization: Customize dash patterns, spacing, and endpoint styles
```
1. **Volume Overlay**
```
- Toggle: Show/Hide, Overlay on Price Chart or Separate Panel
- Advanced Volume Display: Choose from various volume visualization methods (e.g., candles, histograms)
```
1. **News Feeds Integration**
```
- Toggle: Enable/Disable, Customize News Source
- Advanced News Filtering: Prioritize news based on sentiment analysis, customize notification preferences
```
1. **Crosshair Tool**
```
- Toggle: Show/Hide
- Advanced Crosshair Features: Display additional market depth information, show synchronized crosshairs on multiple charts
```
1. **Heatmaps**
```
- Toggle: Enable/Disable, Customize Heatmap Intensity
- Advanced Heatmap Settings: Apply advanced statistical models for heatmap coloring, integrate with custom indicators
```
1. **Trading Sessions Overlay**
```
- Toggle: Show/Hide
- Advanced Trading Session Configuration: Highlight specific session ranges, customize session colors, display extended trading hours
```
1. **Customizable Indicator Parameters**
```
- Options: Adjust parameters for each indicator (e.g., period, smoothing, source)
- Advanced Parameter Tuning: Fine-tune parameters based on market conditions, apply machine learning optimization
```
1. **Pattern Recognition**
```
- Toggle: Enable/Disable
- Advanced Pattern Settings: Customize pattern detection sensitivity, enable specific pattern types
```
1. **Custom Price Scales**
```
- Toggle: Enable/Disable
- Advanced Scaling Options: Use custom scaling factors for price axes, apply logarithmic scaling
```
1. **Price Histogram**
```
- Toggle: Enable/Disable
- Advanced Histogram Options: Customize histogram appearance, apply statistical distributions
```
1. **Chart Background Image**
```
- Toggle: Enable/Disable
- Advanced Image Settings: Upload custom background images, set transparency levels
```
1. **Customizable Trendline Styles**
```
- Options: Solid, Dashed, Dotted, Custom Styles
- Advanced Trendline Customization: Customize trendline thickness, color, and anchor points
```
1. **Session Highlighting**
```
- Toggle: Enable/Disable
- Advanced Session Highlighting: Highlight specific sessions based on custom criteria, adjust transparency
```
1. **Percentage Scale**
```
- Toggle: Enable/Disable
- Advanced Percentage Scaling: Choose reference points for percentage calculation, customize labeling
```
1. **Market Profile**
```
- Toggle: Enable/Disable
- Advanced Profile Settings: Customize profile appearance, apply different calculation methods
```
1. **Custom Symbol Overlays**
```
- Toggle: Enable/Disable
- Advanced Overlay Options: Overlay multiple symbols with custom weightings, apply correlation analysis
```
1. **Custom Date Range Selection**
```
- Toggle: Enable/Disable
- Advanced Date Range Options: Select specific historical date ranges for analysis
```
1. **Floating Data Boxes**
```
- Toggle: Enable/Disable
- Advanced Data Box Options: Customize content, position, and appearance of floating data boxes
```
1. **Customizable Candlestick Colors**
```
- Toggle: Enable/Disable
- Advanced Color Customization: Customize bullish and bearish candlestick colors separately
```
1. **Customizable Bar Colors**
```
- Toggle: Enable/Disable
- Advanced Color Customization: Customize up and down bar colors separately
```
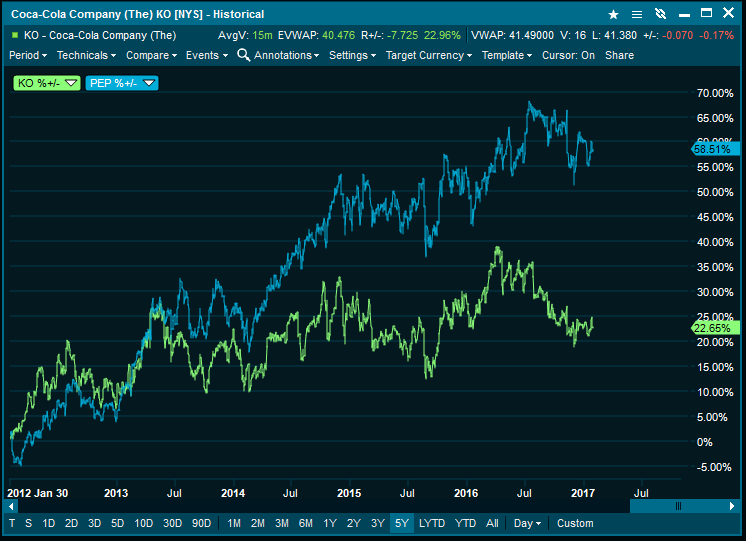
## Compare Studies
A compare study adds a second price line for another symbol to the chart. In the Compare drop down in the chart, select the type of compare study you want, then select what symbol you want to compare it to. Given two symbols A and B, the available options are:
A indexed to B
A rebased to B
A relative to B
B / A (B divided by A)
A / B (A divided by B)
B - A (the difference between B and A)
A - B (the difference between A and B)
A \* B (A multiplied by B)
A+/-% compared to B+/-%
A+/-% - B+/-% (A and B indexed to 0 in percent)
The default compare field will be set to the same as the main line, normally the last price. It can be changed in the line properties dialog in the parameters section.
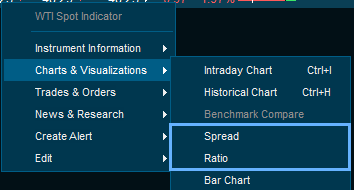
**Spread & Ratio Analysis**
By right clicking on a instrument and then select Charts & Visualization -> Spread or Ratio a new prompt will appear allowing for second instrument to be entered.
Once entered either a spread or a ratio study will be created on the two selected instruments. The spread/ratio is also presented with additional chart data. The chart data is based on the selected time period of the chart.
## Default Chart
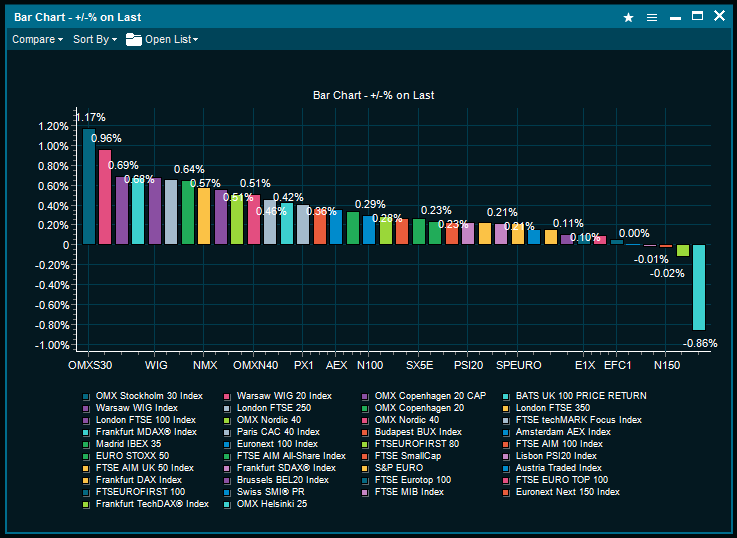
**Description**
The bar chart displays one or more instruments side-by-side in a bar chart. As a default it will display the selected instruments net change in percent. It can be configured to chart a number of historic values in order to quickly compare the instruments performance against each other.
**How to access**
Select a range of symbols in a Market Window, Composite Window or a Market Page and select Chart > Bar Chart
## Orderbook
**How to open**
Orderbooks can be opened by:
* Right-clicking on a symbol from any list of symbols and selecting "Orderbook".
* Type orderbook in search and press enter, then type the symbol you want to see an orderbook for.
**General**
Orderbooks displays public buy and sell orders and are available as MBO (Market by order) and MBL (Market by level). The terminal offers access to both Level 1 data and Level 2 data as well as consolidated orderbooks (combines orderbooks from the main listing exchange with multilateral trading facilities).
The order book window can be linked with order windows, see Linking windows for more information. For selected markets the Orderbook can be displayed differently, e.g FX or Fixed Income data.
**Example**
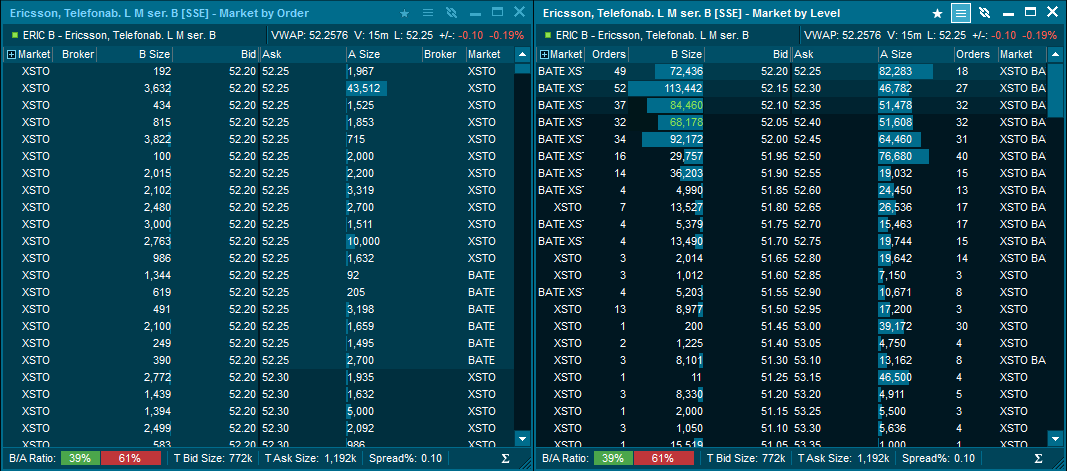
The example shows a MBO orderbook (left) and a MBL orderbook (right)
**Market by Level (MBL) Orderbook** - In this kind of orderbook all the public orders on a symbol from a specific exchange are accumulated into unique price levels. So if there are 35 orders at 52,30 SEK, there will be only one level in the orderbook with an accumulated volume of 55,748.
**Market by Order (MBO) Orderbook** - The Market by Order orderbook contains all details o single orders in the public orderbook. An MBO orderbook may contain a large number of orders with exactly the same price. So you get much more detailed information about each order in the market.
**Trading** - If you place an order through a trading service using the Terminal, the orderbook will highlight the price level that matches the price of your active order (green below). The feature is on by default, but can be turned off in Settings.
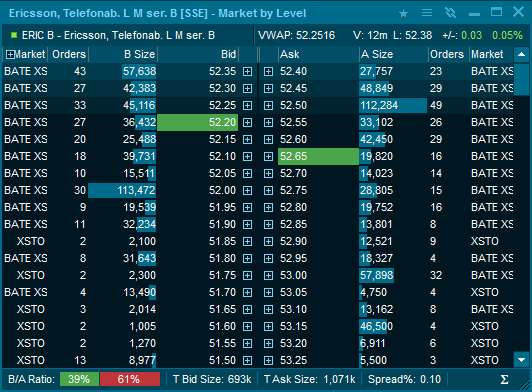
An active buy order placed at price 52.20 and active sell order placed at price 52.65
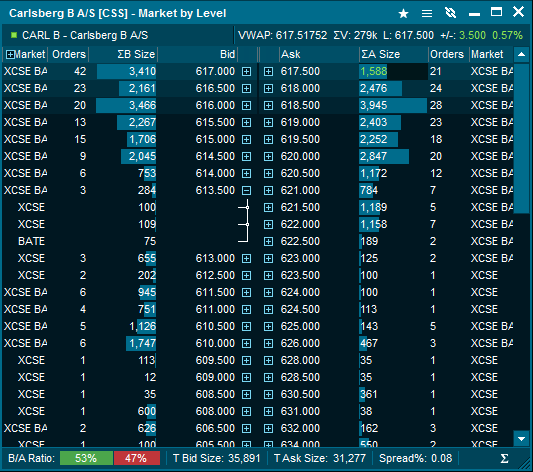
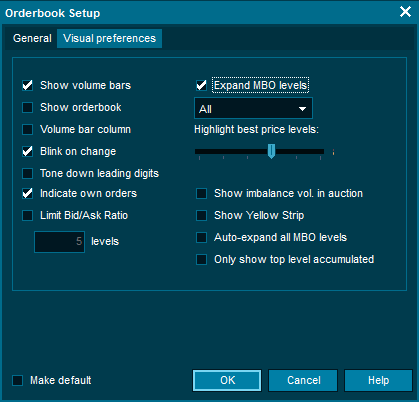
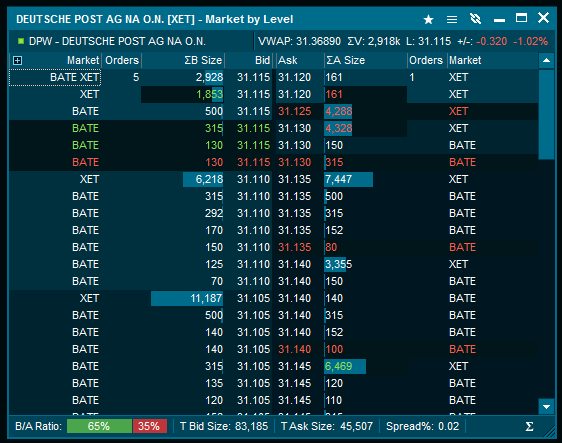
**Market By Level from MBO Orderbooks** - Sometimes the MBO orderbooks may contains just too much information to be useful or digestible.
Accumulated MBL orderbooks aggregate all the orders that have the same price into one level. The advantage is that the detailed MBO information available. Each order will get a separate line in the orderbook viewable by clicking the + next to bid/ask.
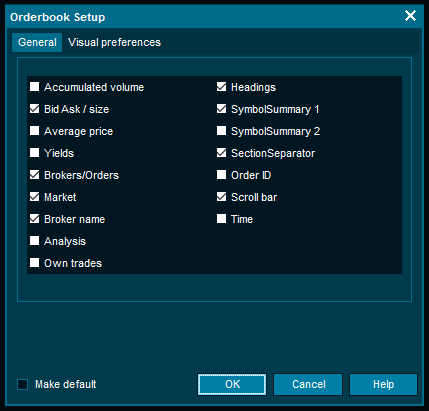
To switch this on use the Window tool menu and select the "Visual preferences" tab. Select "Expand MBO levels" and then OK.
**Summary lines**
The Orderbook contains two summary lines. These can be turn on/off by right-clicking in the Orderbook:
* Summery line 1: Symbol ticker / Symbol description / VWAP / Volume / Last / Net change / Net Change %
* Summery line 2: ISIN / Feed code / Feed name / Symbol code / Symbol Status / High / Low
**Suspensions**
If an instrument (normally a stock) is suspended, the Orderbook will automatically be displayed with a X mark. It is also possible to define a color for a suspended quote under Edit colors ”Background if Status Set".
**Display of Auction Surplus volumes**
Display imbalance volume in an opening or closing auction on the following exchanges; Xetra Frankfurt, Euronext Paris, Copenhagen, Helsinki, Stockholm, Oslo.
**Quote Driven Markets (LSE)**

## Orderbook Visualizer
The OB Visualizer proposes a graphic display of the current state of the order book. This allows the user to have a visual interpretation of the order book.
**Interpretation**
The OB Visualizer has a X-axis representing the aggregate volume (sum of volumes at each price level), and a Y-Axis representing the price. The chart displays what is the available liquidity at each price level of the order book. One can think about it as “who is willing to buy at $10, would also like to buy at $9; Who is willing to sell at $10, would also like to sell at $11”. Because of this logic, we can see it as an aggregation of the volume in a stepped fashion, where each step represents the next price level (that since they are more favorable to the trader sitting on the best bid and offer, we can aggregate them.
The graphic display of the Order Book has two main objectives. One is to deliver an easy-to-learn chart that enables the user, in a matter of seconds, understand the market sentiment for the security under analysis for a given day; the other, to infer changes on the expectations about its fundamental value and perceived risk, as well as capture intraday market microstructure imperfections that create price distortions.
For the identification of the market sentiment for the instrument, the scope of interest is high since the order book is more informative about the aggregate supply and trading interests than quoted volumes and prices. With the possibility to compare today’s liquidity dynamics with respect to averages, the analysis will be enhanced allowing the user to spot changes on the instrument’s liquidity supply. Moreover, the range of prices at which the chart analysis is performed has also different usages. Let us consider the analysis of the time series. The timeframe selection is obvious and it depends on the user’s interest, and this will also define the price range under analysis. Working with a live feed of the Order Book, the range selection is less obvious and we then provide the user with Range Filters that will facilitate the reading of the chart and the inference of information. If the user analyses the order book with the full range, i.e. from the minimum value of Bid and the maximum of Ask, then the use of the OB Visualizer is to read changes on the expectations regarding the fundamental price of the instrument. For example, one might notice that closer to earnings release dates the shape will tend to widen, i.e. the bid and ask legs will spread out.
On the other hand, and shorter price rage is best for analyzing intraday market microstructure imperfections and profit from its mean reverting dynamics. In addition, the shape of the order book reveals a lot of information regarding the fundamental characteristics of the firm: solid, larger, and liquid companies tend to have a distribution of order prices that converge in the current best bid and offer; on the other hand, small, less stablished companies, tend to have limited volumes and a high price dispersion.
## Consolidated Orderbook
**Description**
The Consolidated Orderbook window displays the depth of orders consolidated across multiple markets (feeds) in a single view. With the fragmentation of the equity markets (due to Mifid), it has become harder than ever to get the full market view. With the Consolidated Orderbook you will have one window instead of looking at different orderbooks individually for the same security. By right-clicking on any symbol you will have instant access (by searching on ISIN codes), where each order is displayed with the feed code, price, volume etc. The information displayed can easily be tailored according to your requirements.
*Requirements:*
* Access to Realtime Level 1, Level 2 or full order depth from any exchange
* Access to ISIN codes
* Access to Cross Market Indicators from the terminal
*How to access:*
* The Consolidated Orderbook can be opened by right-clicking on a symbol in the Market Window or Composite Window and selecting Consolidated Orderbook.
* Or by clicking on the Sum symbol in the bottom right corner of a regular orderbook.
**Example**
The consolidated orderbook also gives the user the ability to quickly get a break down overview of where the liquidity is at any given moment by hitting the plus sign on the left side of the instrument name in the top summary bar
**Main features**
* A search for symbols with the same ISIN & currency as the main symbol is automatically initiated when the window opens
* All prices are converted to the same currency easily selectable by the user
* Calculated prices are displayed in italic font
* Trading can be initiated by double clicking in the grid
* Quick access to Compare study
* Manually symbol search available
* The displayed columns and the symbol list can be edited
* Symbol list can be manually edited by right-clicking
* Symbol lists can be saved and shared with Composite Windows
**Consolidated Trade Info bar**
The Consolidated Trade Info bar displays the volume weighted average price (VWAP), Volume and Turnover across all selected symbols converted to the same currency. The bar can be turned on/off under Setup Info Bars.
**Volume Distribution bar**
The Volume Distribution bar displays the volume in percent for each exchange. The bar can be turned on/off under Setup|Info Bars.
**Trade Volume Distribution Info bar**
The Trade Info bar displays each symbol ranked by trade volume. By double-clicking on an instrument the Symbol Window will be displayed. The bar can be turned on/off under Setup|Info Bars.
**Best Bid and Offer % Info bar**
The Best Bid and Offer % Info bar displays each symbol ranked by the percentage of time it has held the top position of the bid and ask sections. Note that the ranking is calculated from the time the consolidated orderbook window is opened. A value of 100% means that the symbol has been in the top level of both the bid and ask section the whole period. By double-clicking on an instrument the Symbol Window will be displayed. The bar can be turned on/off under Setup|Info Bars.
**Changing to another symbol**
To change to another symbol just type in the symbol code on your keyboard and press enter. Based on the selected symbol, a search based on the same ISIN code as the selected symbol will be started. The symbols will automatically be displayed in the window. To edit the symbols displayed click on the wrench icon and select Setup|Symbols.
**Trading from Consolidated Orderbook**
In order to place an order double-click on the Price or Volume in the grid or right-click and select Buy or Sell on the symbol menu.
**Hide non-tradeable symbols**
Symbols that is not tradeable can easily be removed by right-clicking and selecting "Hide non-tradeable symbols"
**Settings and customization**
The Consolidated Orderbook setup enables you to customize and filter the information displayed.
**Setup**
The setup menu can be found by clicking on the wrench icon in the window.
The Symbol menu enables you to delete existing symbols and hide non-tradeable symbols.
The Display tab enables you to customize Grid Columns displayed and the Visual preferences.
The Info Bars tab enables you to turn off and on the bars displayed.
**Symbol search**
In order to search for new symbols and adding new the Search symbols menu will automatically search for symbols with same ISIN codes.
**Target currency and Calculated prices**
The currency displayed in taken from the main symbol, however it is possible to easy change to another currency by right-clicking and selecting "Target Currency" and choosing your preferred currency. Please note that the currency are based in the Terminal USD forex feed available in the Cross Market Indicators package.
Calculated prices will be displayed in italic font. This can be changed under Setup.
**Save screen space Remove Extra information**
If you want to maximize the screen usage press F12 for turning caption on/off and F11 for extra information.