> For the complete documentation index, see [llms.txt](https://docs.satoshiterminal.io/llms.txt). Markdown versions of documentation pages are available by appending `.md` to page URLs; this page is available as [Markdown](https://docs.satoshiterminal.io/research-suite/user-guide/electronic-trading.md).
# Electronic Trading
## Trading Panel
**How to open**
Select Tools, Advanced Settings from the main menu.
**Defaults**

**Default volume -** Set the default board lots you wish to see in the order entry window. (A board lot is a standardized number of shares defined by a stock exchange as a trading unit).
**Default valid -** The number of days an order should be valid for.
**Default order type -** When opening an order entry window, this setting allows you to specify the default order type.

**Default portfolio -** Useful if you have access to more than one portfolio.
**Default active -** Orders can be sent as active or inactive to your trading service.
**Default comment -** Some trading services allow for comments to be sent. Use Default comment if you would like to include information in a comment by default.
**Custom volume increment -** The volume field of an order entry window can be made to increase or decrease by a certain amount when clicking on the up and down arrows or using the up and down arrows on your keyboard.
**Limits**

**Limit per order -** set the currency value per order as a limit. If you exceed the limit per order, the gross price field will highlight in a red color and you will receive a warning.

**Limit per day -** As with the limit per order, you can also specify a currency value limit per day. You will also receive a warning.
**Trading Alerts**

**Confirm order request -** If this is ticked, then you will be asked to confirm before the order is placed.

**Fat finger alert -** Specify how far away from the current bid/ask spread the price you enter should be before it triggers a warning. This is useful to safeguard against typing in extra numbers by accident. In the example below, the user typed in 2000 instead of 200 as the price.
**Short sell warning** - Checks the volume of long positions in your portfolio for an instrument you are selling and warns you if you are selling more than you own.
**Confirm order executed** - Get a confirmation when the trading service confirms your order as executed.
**Tick size warning** - Warns you when the price you enter violates tick size rules of the exchange or market place.

**Show alert on incoming care orders** - Get an alert if a care order has been received from the trading service.
**New order window**

**Allow multiple windows** - By default only one is shown in the terminal.
**Keep open** - When an order has been placed, the default is to close the new order window. Use this setting to keep the new order window open.
**Set background color for buy/sell** - When placing a buy or sell order via the right-click menu or via keyboard shortcuts, the background color of the new order window will be colored green for buy orders and red for sell orders.
**Shows advanced fields -** When opening a new order window, defines whether the advanced fields should be shown immediately or hidden until you click on Adv.
**Auto-expand advanced fields** - If shows advanced fields is turned off, tabbing with your keyboard through the new order window will make the advanced fields show up automatically after gross price.
**Enable gross price field** - The gross price field is displayed in an order entry window. This option switches on the ability to type in your own gross price. If you have also entered a price, then the closest volume corresponding to the gross price will be calculated for you. In the example below a price of 347 and gross price of 100,000 was entered. The terminal then calculated a volume of 288 automatically.

**Do not re-size linked order windows** - in a compact workspace, it may be desirable to not re-size the new order window when changing instruments.
**Hit orderbook, join orderbook** - When opening an new order window buy clicking BUY (or SELL)
Hit orderbook will place the price at the best ask price (best bid price for SELL orders)
Join orderbook will place the price as the best bid price (best ask price for SELL orders)
**Price Tick Size Factor** - Only available for FX RFQ trading - When increasing or decreasing the price of a new order with the up and down arrows, will multiply by a factor of X with the tick size rules. Example: If the factor is set to 3, and the tick size is 0.0001, then clicking up the up arrow on the price field will increase the price by 0.0003.
**Buy/Sell button** - When opening a new order window by clicking on BUY or SELL from a right click menu or using keyboard shortcuts. This setting defines the behavior of the BUY and SELL buttons.
Normal - Both buy and sell buttons show up and function as normal
Make default - The BUY or SELL button (depending on what you choose) will be highlighted and pressing ENTER on your keyboard will cause the order to be placed.
Disable other - Will show you but not allow you to click on the SELL button if you have chosen to BUY from the right-click menu or keyboard shortcuts. (disabled the buy button if you have chosen to sell)
Hide other - If you have chosen BUY from the right-click menu or keyboard shortcuts, the SELL button will be hidden (hides the buy button if you have chosen sell)
**Hit on volume** -
in orderbook -
in new order -
**Hit as order type -**
**Trading Window**
The trading window is where you can see all orders, trades and your portfolio positions.
**Allow multiple windows -** Default is to only show one.
**Keep deleted orders -** If selected, then deleted orders will also be shown in the orders tab.
**Column filtering -** Allows the user to filter orders based on various criteria. Below is an example where it is possible to choose to only show portfolio positions in a particular currency.

**Show column filter -**
**Show historic trades and orders -**
**Allow inline modification of order -** Allows the user to edit an order's price or volume by clicking in the field (orders tab) without having to open an modify order window.

**Show fractional prices -** For some markets, the convention is to use fractions instead of decimals.
**Show Turn Orders buttons -** For active orders, this feature allows you to change a buy order to a market sell order (Turns sell orders to market buy orders). These buttons show up in the orders tab.
**Show multiple delete buttons -** If this feature is off, then only one delete button is shown. Select the order and delete it. If it is turned on, three extra options are available: "Delete Buy", "Delete Sell", "Delete All".

**Blink for new orders -** New orders placed will blink in the orders tab
**Blink for new partially filled orders -** Partially filled orders placed will blink in the orders tab
**Automatically refresh portfolio -** When an order is placed or executed, check for updates to the portfolio.
## Transactions
Displays price movements (usually trades) and information regarding the trades such as market place, buyer ID and seller ID.
To filter a trades list for specific volumes, prices, buyers, sellers, market codes and more; see Filtering.
**Example**
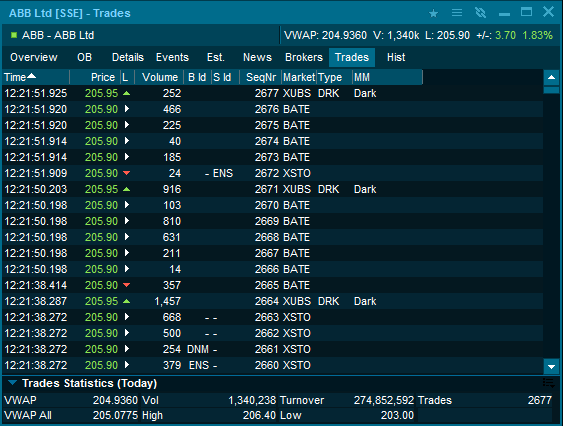
The Trades tab displays today's trades and includes different columns. Some markets can display trades with millisecond accuracy. Simply widen the time field to see if milliseconds are available.
**Trade types**
The exchanges use their own codes to indicate what type of trade was executed. Below are some examples from popular exchanges.
**New York Stock Exchange (Tape A), Equities**
IMSW - Intermarket Sweep Order
CASH - Cash Trade (Same Day Clearing)
AUTO - Automatic Execution
IDET - Intraday trade detail
CAP - CAP Election trade
LATE - Sold Last (Late Reporting)
PREF - Prior reference price
MCOO - Market Center Official Open
SOLD - Sold (out of sequence)
MRCT - Market center re-opening trade
MCCT - Market center closing trade
**Nasdaq New Markets, Equities**
A - Acquisition
B - Bunched Trade
C - Cash Trade
D - Distribution
E - Placeholder for future use
F - Intermarket Sweep
G - Bunched Sold Trades
H - Price Variation Trade
K - Rule 155 Trade (AMEX)
L - Sold Last
M - Market Center Close Price
N - Next Day
O - Opened
P - Prior Reference Price
Q - Market Center Open Price
R - Seller
T - Pre-Open and Post-Close Market Trade
U - Extended Trading Hours/Sold out of Sequence
V - Stock-Option Trade
W - Average Price Trade
X - Cross Trade
Y - Yellow Flag
Z - Sold (Out of Sequence)
0 - Odd lot execution
1 - Stopped Stock- Regular Trade
2 - Stopped Stock - Sold Last
3 - Stopped Stock - Sold (Out of Sequence)
4 - Derivatively Priced
5 - Re-opening Prints
**London Stock Exchange, UK Equities**
SPEC - Special Trade (Outside spread)
AT - Automatic Trade
UT - Uncrossing Trade
PT - Closing Price Crossing Session Trade
PC - Orderbook contra not same day
IX - Internal Cross
IB - Internal Block Trade Facility
CX - Committed Cross
CB - Committed Block Trade Facility
O - Ordinary Trade
OK - Ordinary Trade - delayed
NT - Negotiated Trade
NK - Negotiated Trade - delayed
LC - Cancellation of on-Exchange Trade
GC - Cancellation of GILT & UKGT segment trades
NM - Not to Mark
NC - Cancellation of NM Trade
OT - OTC Trade
TK - OTC Trade - delayed
IF - Inter fund cross - delayed
OC - Cancellation of OTC Trade
SI - SI Trade
SK - SI Trade - delayed
SC - Cancellation of SI Trade
**Johannesburg Stock Exchange, Equities**
BT - Block Trade
OX - Option Exercised
PF - Portfolio Trade
PC - Post Contra Trade (correction of previous day on book trade)
TX - Traded Option Exercised
WX - Warrant Exercised
BK - Book Build
CF - Corporate Finance Trade
OD - Delta Trade
GU - Give Up
LC - Post Contra Trade (correction of previous day published off book trade)
NC - Post Contra Trade (correction of previous day non-published off book trade)
LT - Late Trade (After Hours Trade)
OP - Off Order Book Principal Trade
**Nordic Growth Markets**
Cncl - Cancel
Last - Sold Last
Out - Outside Spread
OutU - Outside Spread Unknown
KOBB - Knockout buyback Trade
SOBB - Soldout buyback Trade
Dist - Distribution Trade
**Trade statistics**
The trade statistics section shows accumulated trade values. If no range is selected, the statistics is calculated from all of today's trades.\
\
If you select specific trades in the trades list by highlighting them, the statistics will calculate from the selected trades.

The trade statistics includes the following fields:
| VWAP | Average price of on-floor trades |
| -------- | -------------------------------- |
| VWAP All | Average price of all trades |
| Vol | Total volume of the trades |
| High | Highest price |
| Turnover | Total turnover |
| Low | Lowest price |
| Trades | Number of trades |
## Brokers
Shows active brokers who have executed trades on the selected symbol (only available for selected markets). Please note, that there are more advanced Broker Statistics available.
**Example**
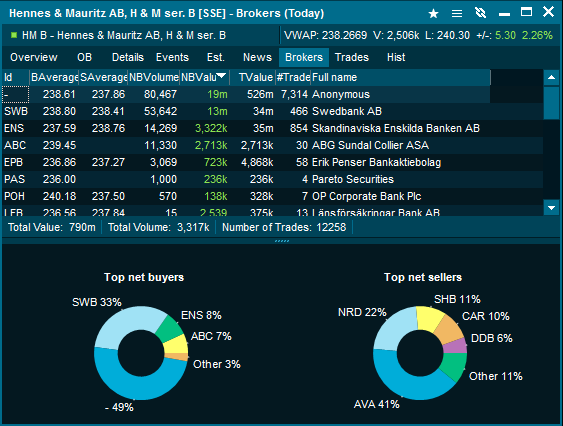
**NBVolume** - Net Buy Volume. Displays the number of shares bought minus the number of shares sold.
**NBValue** - Net Buy Value. Displays the value of shares bought minus the value of shares sold.
**BAverage** - The average buy price for all trades where the broker was identified as the buyer.
**SAverage** - The average sell price for all trades where the broker was identified as the seller.
**TValue** - The total value of all trades placed by the broker, regardless of whether they were buyer or seller.
**Charts** - The pie charts show the % distribution of top net buyers and top net sellers.
There is a lot of interesting information to analyze in the brokers tab. Amongst other things, it can give you an idea of the distribution of buying and selling activity between international and local exchange members.
***
**All Brokers**
**How to access**
* Select Broker Statistics from the main menu, select the Market from the list, click OK and go to the first tab "All Brokers"
* Right-click on any equity symbol, go to Other > Broker statistics. If this menu option is not available, then broker statistics are not supported for that market.
**Description**
Broker statistics show accumulated data for all the brokers active on one specific market. Double click on one of the brokers to drill down into symbols that the current broker has placed orders in on the market.
**Table View**
In the table view, each broker is represented with number of trades executed, turnover and more.
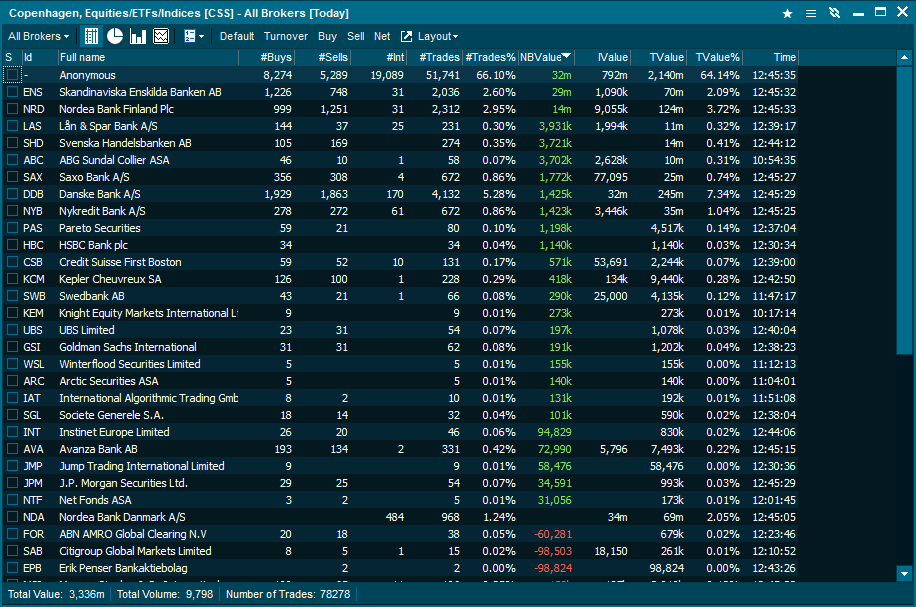
**Available columns**
* S (Checkbox for Timeline Selected)
* Full name (The brokers name)
* ID (The brokers ID)
* Time (time of last trade/update)
* \#Buys (Number of Buy Trades)
* \#Sells (Number of Sells Trades)
* \#Int Trades (Number Internal Trades)
* \#Trades (Total number of Trades
* \#Trades % (Trades shown in percent of total trades)
* NB Value (Net Buy Value)
* IValue (Internal Value)
* TValue (Turnover Value)
* TValue% (Turnover Value in percentage)
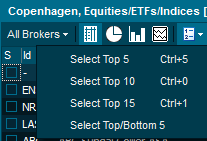
**Select criteria to drill down**
Use the "show" drop-down to select a range of brokers you want to see visually, or tick the checkboxes to the left of the broker codes.
**Pie - Totals**
The pie chart provides a visual representation of all broker statistics data.
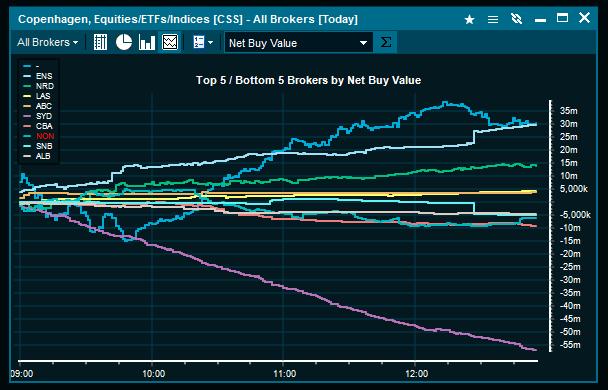
**Timeline - Selected**
The Timeline enables you to select different brokers and view more details regarding changes. In the example below, an intraday timeline of net buy value with the top and bottom 5 brokers is shown.
***
**Single Brokers**
**How to access**
* Select Broker Statistics from the main menu, select the Market from the list, click OK and go to the first tab "Single Broker". Choose a broker from the drop-down list.
* Right-click on any equity symbol, go to Other > Broker statistics, then change to the Single broker tab. If this menu option is not available, then broker statistics are not supported for that market.
**Description**
Broker statistics for a Single Broker provides you with accumulated data for one selected broker. The information is displayed as columns, pie chart or line charts.
**Table - Totals**
The Table provides you with various statistics updated in realtime.
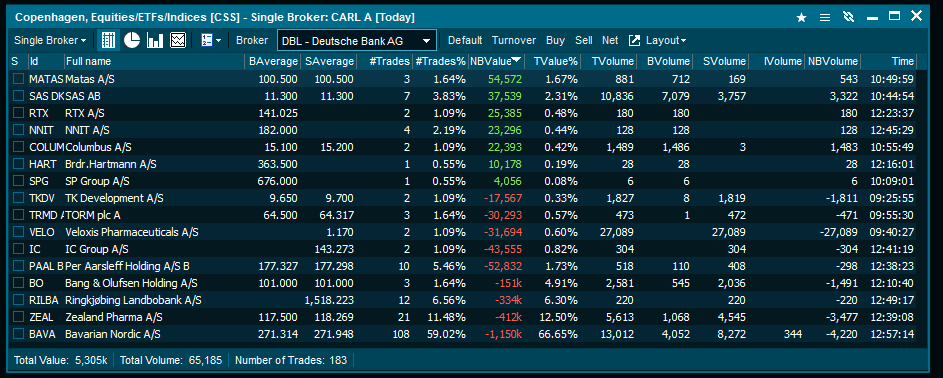 **Available columns**
* S (Checkbox for Timeline Selected)
* Full name (The brokers name)
* ID (The brokers ID)
* Time (time of last trade/update)
* \#Buys (Number of Buy Trades)
* \#Sells (Number of Sells Trades)
* \#Int Trades (Number Internal Trades)
* \#Trades (Total number of Trades
* \#Trades % (Trades shown in percent of total trades)
* NB Value (Net Buy Value)
* IValue (Internal Value)
* TValue (Turnover Value)
* TValue% (Turnover Value in percentage)
**Pie - Totals**
The pie chart provides data on the selected criteria visually.
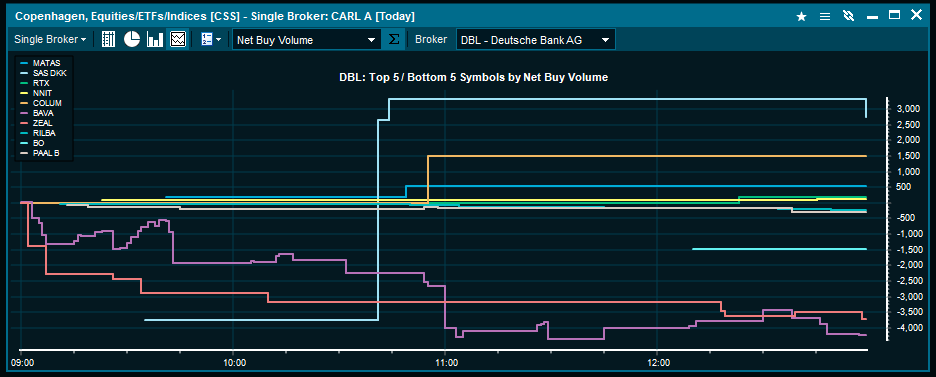
**Timeline - Selected**
The Timeline view enables you to select different brokers and see statistics regarding symbols for the given market.
***
**Single Symbol**
**How to access**
* Select Broker Statistics from the main menu, select the Market from the list, click OK and go to the first tab "Single Symbol". Choose a symbol from the drop-down list.
* Right-click on any equity symbol, go to Other > Broker statistics. If this menu option is not available, then broker statistics are not supported for that market.
**Description**
This view displays accumulated data on all brokers active for the selected symbol. This enables you to get fast access to the brokers that are the largest buyers, sellers. most active etc.
**Available columns**
* S (Checkbox for Timeline Selected)
* Full name (The brokers name)
* ID (The brokers ID)
* Time (time of last trade/update)
* \#Buys (Number of Buy Trades)
* \#Sells (Number of Sells Trades)
* \#Int Trades (Number Internal Trades)
* \#Trades (Total number of Trades
* \#Trades % (Trades shown in percent of total trades)
* NB Value (Net Buy Value)
* IValue (Internal Value)
* TValue (Turnover Value)
* TValue% (Turnover Value in percentage)
**Changing Symbol code**
In the Symbols page you can switch to another symbol on the same market by just starting to type the symbol code.
**Pie - Totals**
The pie chart provides data on the selected criteria visually.
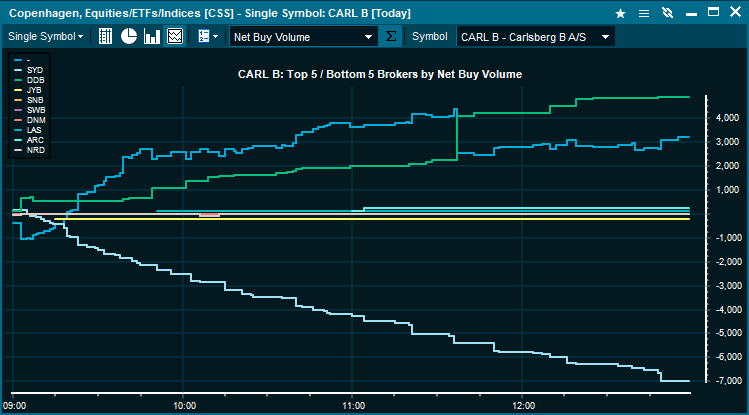
**Timeline - Selected**
The Timeline view enables you to select different statistics to view and change the symbol for the given market. Below are the Top/bottom 5 brokers Net Buy Volume for Carlsberg B A/S .
**Available columns**
* S (Checkbox for Timeline Selected)
* Full name (The brokers name)
* ID (The brokers ID)
* Time (time of last trade/update)
* \#Buys (Number of Buy Trades)
* \#Sells (Number of Sells Trades)
* \#Int Trades (Number Internal Trades)
* \#Trades (Total number of Trades
* \#Trades % (Trades shown in percent of total trades)
* NB Value (Net Buy Value)
* IValue (Internal Value)
* TValue (Turnover Value)
* TValue% (Turnover Value in percentage)
**Pie - Totals**
The pie chart provides data on the selected criteria visually.
**Timeline - Selected**
The Timeline view enables you to select different brokers and see statistics regarding symbols for the given market.

***
**Single Symbol**
**How to access**
* Select Broker Statistics from the main menu, select the Market from the list, click OK and go to the first tab "Single Symbol". Choose a symbol from the drop-down list.
* Right-click on any equity symbol, go to Other > Broker statistics. If this menu option is not available, then broker statistics are not supported for that market.
**Description**
This view displays accumulated data on all brokers active for the selected symbol. This enables you to get fast access to the brokers that are the largest buyers, sellers. most active etc.
**Available columns**
* S (Checkbox for Timeline Selected)
* Full name (The brokers name)
* ID (The brokers ID)
* Time (time of last trade/update)
* \#Buys (Number of Buy Trades)
* \#Sells (Number of Sells Trades)
* \#Int Trades (Number Internal Trades)
* \#Trades (Total number of Trades
* \#Trades % (Trades shown in percent of total trades)
* NB Value (Net Buy Value)
* IValue (Internal Value)
* TValue (Turnover Value)
* TValue% (Turnover Value in percentage)
**Changing Symbol code**
In the Symbols page you can switch to another symbol on the same market by just starting to type the symbol code.
**Pie - Totals**
The pie chart provides data on the selected criteria visually.
**Timeline - Selected**
The Timeline view enables you to select different statistics to view and change the symbol for the given market. Below are the Top/bottom 5 brokers Net Buy Volume for Carlsberg B A/S .
 ## Filtering
**Trades**
By default all trades are displayed for the selected symbol. To set a filter on the what trades to display, right-click in the window while on the trades tab, and select "Show Filter".
**Example**
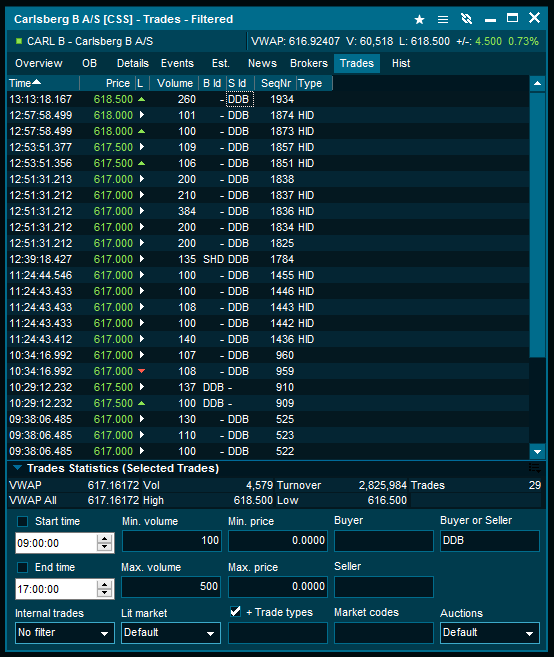
In the above example a volume between 100-500 was selected, and Buyer ID or Seller ID was set to DDB. The trades list is then only displaying trades which meet the criteria.
**Min and Max Volume** - Set a minimum and maximum volume for trades which should be shown in the trades list.
**Buyer, Seller and Buyer or Seller** - Use Broker IDs (only some exchanges send out this information) to filter out buyers and sellers.
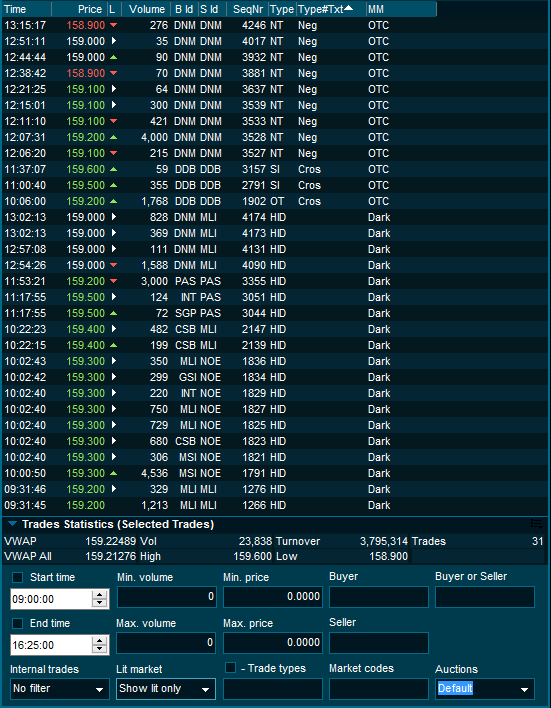
**Trade type** - Filter to only show specific trade types. To filter more than one trade type use a comma. "STND,HID".
**Auctions** - For markets with opening, closing and/or mid-day auctions. Filter to only show trades placed during an auction period.
**Internal trades** - Display trades where the buyer id and the seller id are the same. The filter can be set to only show internal trades, or to exclude them from the list
**Start time and End time** - Set the time period for trades which should be shown in the trades list.
**Lit market** - Filter between lit and non-lit trades. Example below.
## FX Trading
The program includes support for FX trading of spots and forwards if your provider supports it. You can place and execute deals on both asset classes and follow the deals of the day to get a full overview of FX deals.
The following windows are available for FX Trading:
**FX Spots Window -** Enables a grid view which can be customized to view selected spot currencies.
**FX Forward Window -** Enables a grid view which can be customized to view selected forward currencies.
**Trading Window -** Providing overview of your Deals and Deal Requests.
**New Deal Window -** Standard window for placing both spot and forward orders.
**FX Spots Window**
The FX Spots window is the main window for displaying spot prices in the terminal. It is a grid consisting of the spots of your selection which can easily be customized.
Each spot in the grid consists of:
* Name of currency cross
* Button to view a chart of the spot
* High/Low
* The Sell and Buy price
* Tick indicator to display positive/negative change on price
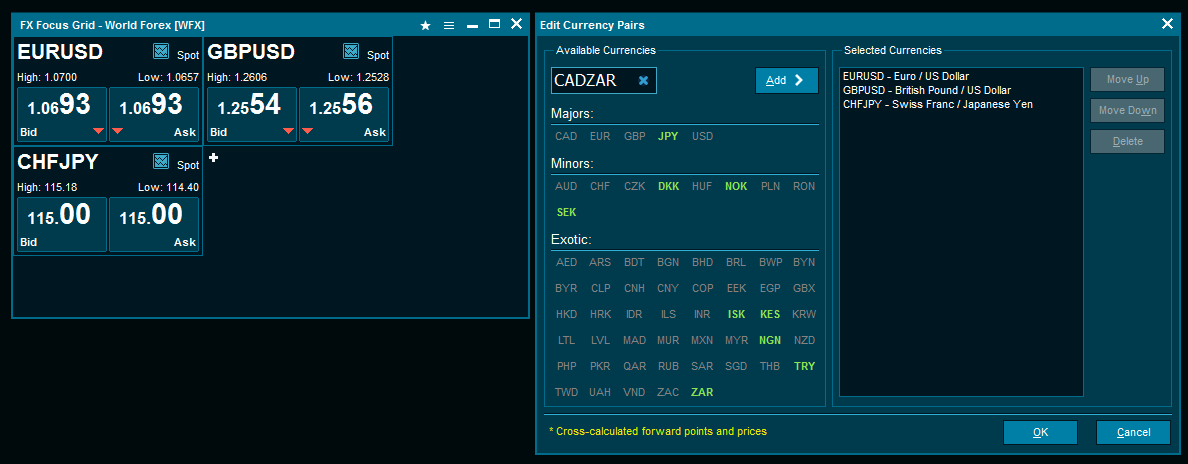
**Currency setup**
Before you can use the FX Spots Window, you need to add the currency pairs you want to follow. The currency setup can be accessed by clicking the "+" sign in the spot grid or by clicking the wrench icon in the top left corner followed by "Edit currency pairs".
There are two ways to add a new cross rate to the grid: By typing in the cross in the top left field or by click on the available currencies in the window. Typing in a cross and pressing "enter" or "add" will move that cross to the "Selected currencies list". Typing in an unavailable cross the field will turn red and adding it in incorrect order will make the field yellow. When selecting a cross by using the mouse unavailable crosses will go from bold to normal.
**FX Forwards Window**
The FX Forwards Window gives you a quick overview selected currency pairs.
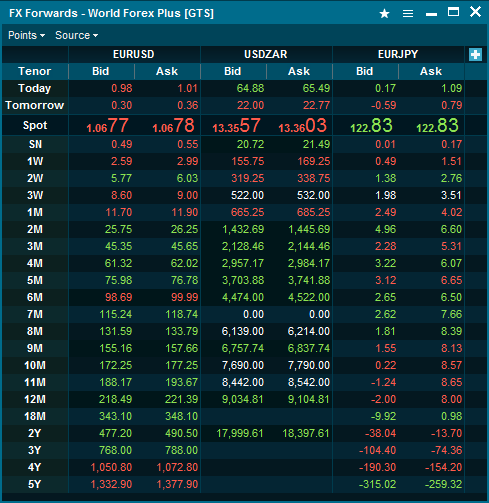
**New Deal Window**
The New Deal window is the main window for placing deal request for both spots and forwards. The fields displayed in this window will change based on the tenor selected. For instance a forward deal may contain fields such as forward points, NDF fixing selection and spot points. The window can be accessed by clicking any price in the spot or forward grid.
## Order Management System
**How to open**
Orderbooks can be opened by:
* Right-clicking on a symbol from any list of symbols and selecting "Orderbook".
* Type orderbook in search and press enter, then type the symbol you want to see an orderbook for.
**General**
Orderbooks displays public buy and sell orders and are available as MBO (Market by order) and MBL (Market by level). The terminal offers access to both Level 1 data and Level 2 data as well as consolidated orderbooks (combines orderbooks from the main listing exchange with multilateral trading facilities).
The order book window can be linked with order windows, see Linking windows for more information. For selected markets the Orderbook can be displayed differently, e.g FX or Fixed Income data.
**Example**
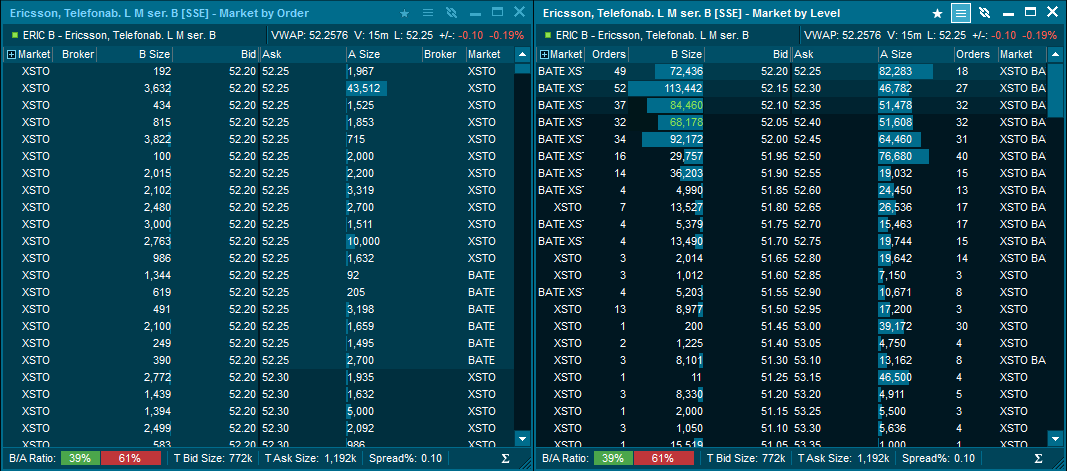
The example shows a MBO orderbook (left) and a MBL orderbook (right)
**Market by Level (MBL) Orderbook** - In this kind of orderbook all the public orders on a symbol from a specific exchange are accumulated into unique price levels. So if there are 35 orders at 52,30 SEK, there will be only one level in the orderbook with an accumulated volume of 55,748.
**Market by Order (MBO) Orderbook** - The Market by Order orderbook contains all details o single orders in the public orderbook. An MBO orderbook may contain a large number of orders with exactly the same price. So you get much more detailed information about each order in the market.
**Trading** - If you place an order through a trading service using the Terminal, the orderbook will highlight the price level that matches the price of your active order (green below). The feature is on by default, but can be turned off in Settings.
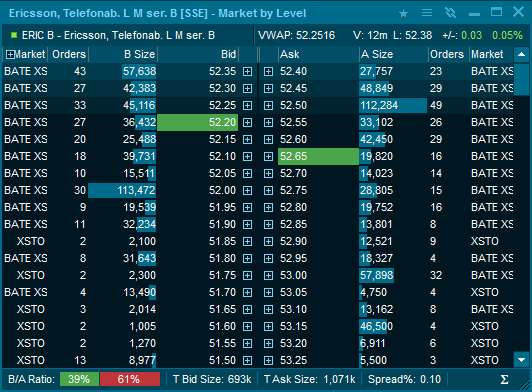
An active buy order placed at price 52.20 and active sell order placed at price 52.65
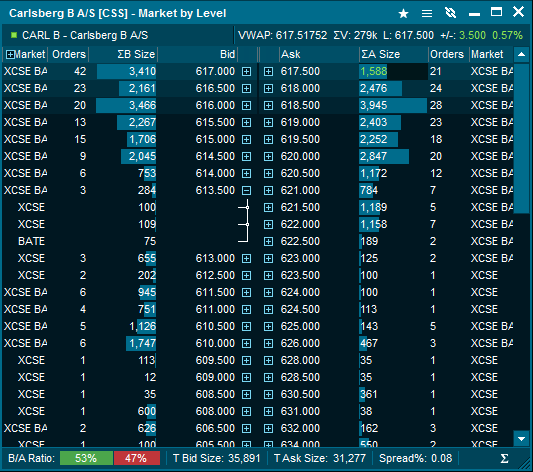
**Market By Level from MBO Orderbooks** - Sometimes the MBO orderbooks may contains just too much information to be useful or digestible.
Accumulated MBL orderbooks aggregate all the orders that have the same price into one level. The advantage is that the detailed MBO information available. Each order will get a separate line in the orderbook viewable by clicking the + next to bid/ask.
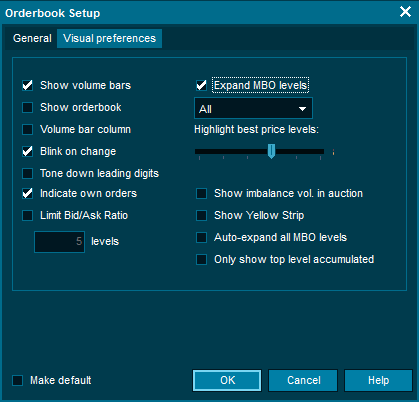
To switch this on use the Window tool menu and select the "Visual preferences" tab. Select "Expand MBO levels" and then OK.
**Summary lines**
The Orderbook contains two summary lines. These can be turn on/off by right-clicking in the Orderbook:
* Summery line 1: Symbol ticker / Symbol description / VWAP / Volume / Last / Net change / Net Change %
* Summery line 2: ISIN / Feed code / Feed name / Symbol code / Symbol Status / High / Low
**Suspensions**
If an instrument (normally a stock) is suspended, the Orderbook will automatically be displayed with a X mark. It is also possible to define a color for a suspended quote under Edit colors ”Background if Status Set".
**Display of Auction Surplus volumes**
Display imbalance volume in an opening or closing auction on the following exchanges; Xetra Frankfurt, Euronext Paris, Copenhagen, Helsinki, Stockholm, Oslo.
**Quote Driven Markets (LSE)**

## Filtering
**Trades**
By default all trades are displayed for the selected symbol. To set a filter on the what trades to display, right-click in the window while on the trades tab, and select "Show Filter".
**Example**

In the above example a volume between 100-500 was selected, and Buyer ID or Seller ID was set to DDB. The trades list is then only displaying trades which meet the criteria.
**Min and Max Volume** - Set a minimum and maximum volume for trades which should be shown in the trades list.
**Buyer, Seller and Buyer or Seller** - Use Broker IDs (only some exchanges send out this information) to filter out buyers and sellers.
**Trade type** - Filter to only show specific trade types. To filter more than one trade type use a comma. "STND,HID".
**Auctions** - For markets with opening, closing and/or mid-day auctions. Filter to only show trades placed during an auction period.
**Internal trades** - Display trades where the buyer id and the seller id are the same. The filter can be set to only show internal trades, or to exclude them from the list
**Start time and End time** - Set the time period for trades which should be shown in the trades list.
**Lit market** - Filter between lit and non-lit trades. Example below.

## FX Trading
The program includes support for FX trading of spots and forwards if your provider supports it. You can place and execute deals on both asset classes and follow the deals of the day to get a full overview of FX deals.
The following windows are available for FX Trading:
**FX Spots Window -** Enables a grid view which can be customized to view selected spot currencies.
**FX Forward Window -** Enables a grid view which can be customized to view selected forward currencies.
**Trading Window -** Providing overview of your Deals and Deal Requests.
**New Deal Window -** Standard window for placing both spot and forward orders.
**FX Spots Window**
The FX Spots window is the main window for displaying spot prices in the terminal. It is a grid consisting of the spots of your selection which can easily be customized.
Each spot in the grid consists of:
* Name of currency cross
* Button to view a chart of the spot
* High/Low
* The Sell and Buy price
* Tick indicator to display positive/negative change on price

**Currency setup**
Before you can use the FX Spots Window, you need to add the currency pairs you want to follow. The currency setup can be accessed by clicking the "+" sign in the spot grid or by clicking the wrench icon in the top left corner followed by "Edit currency pairs".
There are two ways to add a new cross rate to the grid: By typing in the cross in the top left field or by click on the available currencies in the window. Typing in a cross and pressing "enter" or "add" will move that cross to the "Selected currencies list". Typing in an unavailable cross the field will turn red and adding it in incorrect order will make the field yellow. When selecting a cross by using the mouse unavailable crosses will go from bold to normal.
**FX Forwards Window**
The FX Forwards Window gives you a quick overview selected currency pairs.

**New Deal Window**
The New Deal window is the main window for placing deal request for both spots and forwards. The fields displayed in this window will change based on the tenor selected. For instance a forward deal may contain fields such as forward points, NDF fixing selection and spot points. The window can be accessed by clicking any price in the spot or forward grid.
## Order Management System
**How to open**
Orderbooks can be opened by:
* Right-clicking on a symbol from any list of symbols and selecting "Orderbook".
* Type orderbook in search and press enter, then type the symbol you want to see an orderbook for.
**General**
Orderbooks displays public buy and sell orders and are available as MBO (Market by order) and MBL (Market by level). The terminal offers access to both Level 1 data and Level 2 data as well as consolidated orderbooks (combines orderbooks from the main listing exchange with multilateral trading facilities).
The order book window can be linked with order windows, see Linking windows for more information. For selected markets the Orderbook can be displayed differently, e.g FX or Fixed Income data.
**Example**

The example shows a MBO orderbook (left) and a MBL orderbook (right)
**Market by Level (MBL) Orderbook** - In this kind of orderbook all the public orders on a symbol from a specific exchange are accumulated into unique price levels. So if there are 35 orders at 52,30 SEK, there will be only one level in the orderbook with an accumulated volume of 55,748.
**Market by Order (MBO) Orderbook** - The Market by Order orderbook contains all details o single orders in the public orderbook. An MBO orderbook may contain a large number of orders with exactly the same price. So you get much more detailed information about each order in the market.
**Trading** - If you place an order through a trading service using the Terminal, the orderbook will highlight the price level that matches the price of your active order (green below). The feature is on by default, but can be turned off in Settings.

An active buy order placed at price 52.20 and active sell order placed at price 52.65
**Market By Level from MBO Orderbooks** - Sometimes the MBO orderbooks may contains just too much information to be useful or digestible.
Accumulated MBL orderbooks aggregate all the orders that have the same price into one level. The advantage is that the detailed MBO information available. Each order will get a separate line in the orderbook viewable by clicking the + next to bid/ask.

To switch this on use the Window tool menu and select the "Visual preferences" tab. Select "Expand MBO levels" and then OK.

**Summary lines**
The Orderbook contains two summary lines. These can be turn on/off by right-clicking in the Orderbook:
* Summery line 1: Symbol ticker / Symbol description / VWAP / Volume / Last / Net change / Net Change %
* Summery line 2: ISIN / Feed code / Feed name / Symbol code / Symbol Status / High / Low
**Suspensions**
If an instrument (normally a stock) is suspended, the Orderbook will automatically be displayed with a X mark. It is also possible to define a color for a suspended quote under Edit colors ”Background if Status Set".
**Display of Auction Surplus volumes**
Display imbalance volume in an opening or closing auction on the following exchanges; Xetra Frankfurt, Euronext Paris, Copenhagen, Helsinki, Stockholm, Oslo.
**Quote Driven Markets (LSE)**
